Is this the New Normal? Snowmass Real Estate
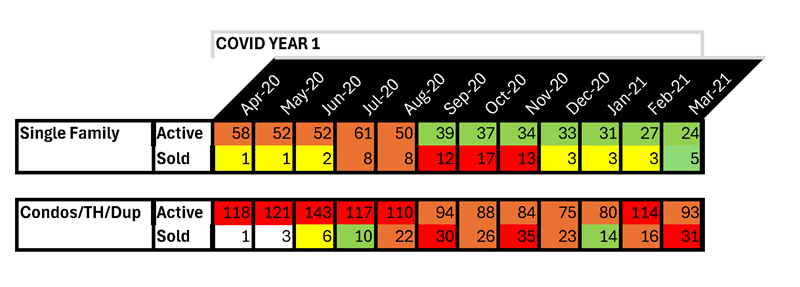
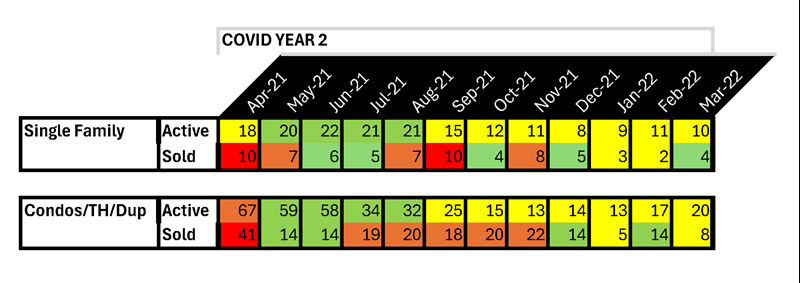
See here a timeline focusing on the number of active listings and sales for every month between January 2019 to April 2024 in Snowmass Village. To help see the pattern, I color coded the totals showing GREEN as the median range during this 5-year period; red is the highest number of listings/sales, yellow the lower number of listings/sales, and green is the median range for this time period.

January 2019 - March 2020 Pre-COVID
The pre-COVID timeframe is significantly RED for the listings of single family homes and condominiums in Snowmass Village, representing the highest amount of inventory we have seen in the past 5 years. Yet, sales were “low to normal” compared to the next 5 years. Listed single-family homes averaged 71 listings per month, and condominiums/townhomes averaged 143 listings per month during this period. The sales were 3 single-family home sales and 11 condos/townhomes per month. 
April 2020 - March 2021 COVID YEAR 1
As soon as people were allowed to travel more easily and work remotely, Snowmass Village real estate saw an explosion of activity. The number of listings for both single-family homes and condos/townhomes remained higher than the median, 41 and 103, respectively. However, the number of sales increased significantly, with an average of 6 single-family homes and 18 condos sold monthly during this time period.

April 2021 - March 2022 COVID YEAR 2 BEGINNING OF NORMAL
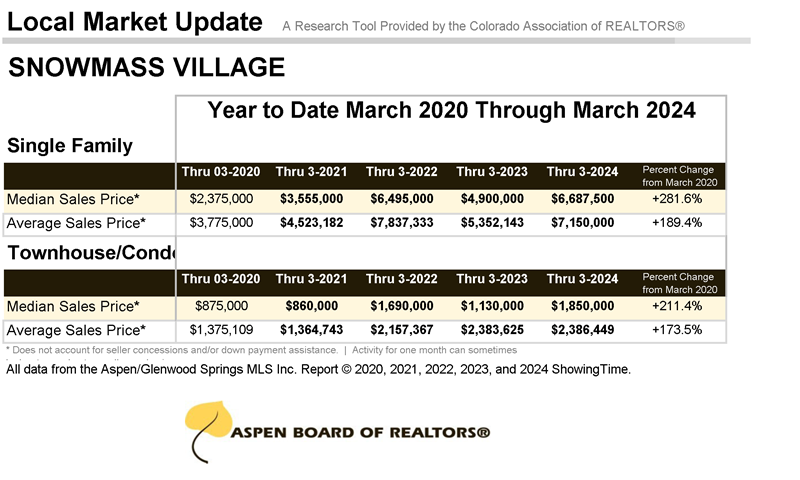
The 2021/2022 ski season saw an increase in skiers visiting the Aspen Snowmass area, along with other North American ski areas, since Europe and Asia were technically closed to visitors for health restrictions. Real estate sales averaged similar to the previous year (monthly sales single-family: 6 and condos/townhomes: 17), but less than half as many listings (average monthly listings single-family: 14 and condos/townhomes: 30). This was also the beginning of the true escalation of sale prices. See below the Median and Average Sale Prices from March 2020 compared to March 2021, 2022, 2023, and 2024. Between March 2021 and March 2022, the sale prices doubled.


April 2022 - March 2023 COVID YEAR 3
As our world became less affected by the pandemic, Snowmass real estate began to level out too. Except for new developments coming to market, the table shows at median or slightly below for listings and sales decreased too. In this era, I heard many real estate owners say, “I can sell for a great price, but where will I go that is better than here?”
April 2023 - March 2024 NEW NORMAL
The past twelve months have seen more “normal” listings and sales than what was experienced over the past five years. Even though the inventory is still on the lower end, the sales have also average listings for single-family homes is 20 and condos/townhomes average is 52. Sales are 3 single-family homes per month and 13 condos/townhomes. Both stats are almost identical to April 2022 - March 2023 period. The interesting part is the sale prices increased from 2023 to 2024, but only up to the level that 2022 reflected. Both the inventory and sale prices are showing a “new normal” for Snowmass Village real estate.

Conclusion
The Snowmass Village real estate market for the rest of 2024 will look very similar to the combination of 2022 and 2023. The inventory of single-family homes on the active market will stay in the 20-30 range and the condos/townhomes will average 50-60.Without an extreme influence, owners will not be pressed to sell their coveted real estate holdings in the Roaring Fork Valley.
The single-family home sales will remain about 4 per month but the sales prices will be higher than 2023 with the average sale price getting closer to the $10 million range. The condos/townhomes will continue to sell on average at 10 transactions per month with a spike in October when the Viceroy Cirque and Aura developments close. Those anticipated sales will increase the average sale price over the $2 million mark.

